

.jpg)
Univ.-Prof. Dr.-Ing. Torsten Leutbecher
Raum: PB-A 111/2
 +49 271 740-2592
 leutbecher@bau.uni-siegen.de
Influence of section depth and maximum aggregate size on the flexural tensile strength of ultra-high performance concrete
Research topic
Design and construction with ultra-high performance concrete (UHPC)
Funding and project duration
German Committee for Structural Concrete (Deutscher Ausschuss für Stahlbeton, DAfStb), Research Project V 512
Duration: January 2022 until June 2023
Person in charge
Jan Schuller, B.Sc.
Objectives
Besides axial tensile strength fct, which is an actual material parameter, Eurocode 2 (EC 2) and fib Model Code 2010 define a so-called flexural tensile strength fct,fl. The flexural tensile strength is a parameter which depends on the concrete tensile strength, the section depth h of the member, and the brittleness of concrete. When calculating stresses and deflections under service loads, uncracked cross-sections may be assumed according to EC 2 if the flexural tensile stress does not exceed the flexural tensile strength fct,fl. The use of fct,fl instead of fct provides a more realistic and at the same time more economical estimate for members with small section depth.
So far, a calculation method for determining the flexural tensile strength did not exist for ultra-high performance concrete (UHPC). This research project therefore aimed to investigate how the section depth influences the flexural tensile strength of UHPC.
Experimental investigations
The test programme comprised the fabrication and testing of 88 specimens each of fine-grained and coarse-grained UHPC without fibres. The compressive strength, the flexural tensile strength, the splitting tensile strength, and the axial tensile strength were determined on the hardened concrete (Table 1). The compressive strength was tested on cubes with an edge length d = 100 mm (Cube100) and on cylinders with a diameter d = 100 mm and a height h = 200 mm (Cyl100). The splitting tensile strength test was also carried out on cylinders Cyl100. Cylinders with a diameter and height of 50 mm each (Cyl50) were used for the non-standardised direct tensile tests. The flexural tensile tests were carried out as four-point tests on prisms with a width b = 100 mm and different section depths h = 30, 40, 50, 70, 100, 150, and 200 mm (labelled P30 to P200). The prisms were cast horizontally approximately 2 cm higher than the nominal dimension. They were later cut to the nominal dimension using a concrete saw. This served to remove the edge zone on the casting side, which can have a slightly more porous structure, and to obtain a uniform geometry of the cross-section over the entire length of the test specimen. In order to minimise pre-damage due to residual stresses and to exclude effects of a moisture gradient, all specimens were cured in water until testing.
The cylinder and cube compressive strengths were on average fcm = 161.5 MPa and fcm,cube = 174.4 MPa in Series 1 as well as fcm = 161.1 MPa and fcm,cube = 174.1 MPa in Series 2. While the mean values of the compressive strengths of fine-grained and coarse-grained UHPC hardly differed, the mean axial tensile strength of the fine-grained UHPC fctm = 10.86 MPa was approximately 17 % higher than the mean axial tensile strength of the coarse-grained UHPC fctm = 9.30 MPa. The splitting tensile strengths of the fine-grained and coarse-grained UHPC also differed significantly with fctm,sp = 11.53 and 8.56 MPa. The mean values of the flexural tensile strength fctm,fl = 15.22 to 18.93 MPa for the fine-grained UHPC and fctm,fl = 10.26 to 16.99 MPa for the coarse-grained UHPC were above the corresponding axial tensile strength fctm and showed a clear dependency on the section depth. For the same section depth, the coarse-grained UHPC also showed the lower strength compared to the fine-grained UHPC. The coefficients of variation were 1.1 to 4.5 % for the compressive strength, 6.7 and 7.7 % for the axial tensile strength, 4.8 and 8.0 % for the splitting tensile strength and 3.7 to 10.5 % for the flexural tensile strengths.
Relationship between compressive strength and axial tensile strength
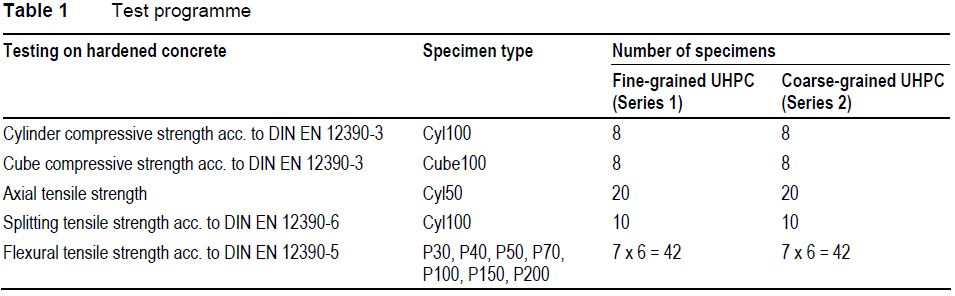
To classify the axial tensile strengths fctm determined in the own study, the results are plotted in Fig. 1 as function of fcm together with further data on UHPC without fibres. The legend to Fig. 1 shows the specimen shape, the cross-sectional area of the tensile specimen Ac, the maximum aggregate size Dmax, and the condition of curing (CC) for each study or series. In addition to the test data, Eqs. (1) and (2) have been analysed, which may be used according to EC 2 and fib Model Code 2010 to determine the mean axial tensile strength fctm of normal strength concrete (NSC) and high strength concrete (HSC) as function of the compressive strength. The characteristic value of the concrete compressive strength was approximated by fck = fcm - 8 MPa when evaluating Eq. (1).

 Besides a wide range of results, it can be seen that the axial tensile strength of concretes with fcm between 145.0 and 209.1 MPa is underestimated by Eq. (2) almost without exception. In some cases, the experimentally determined tensile strengths are more than twice the axial tensile strength predicted by Eq. (2). However, with two exceptions, the results lie within the quantiles of Eq. (1) for NSC. Furthermore, it is noticeable that tensile specimens with small stressed cross-section tend to provide higher tensile strengths than tensile specimens with large stressed cross-section. Exceptions are the own investigations and the study by Ma, which are in the upper range of tensile strengths despite large stressed cross-sections. In both studies, the specimens were stored in water until testing (WC), while all other studies applied heat treatment (HT) or storage in dry climate (room climate, RC). With the latter two conditions of curing, residual stresses due to a temperature or moisture gradient are more likely than with water curing. It can therefore be assumed that the observed influence of the area of the stressed cross-section on the tensile strength is primarily caused by residual stresses.
Relationship between flexural tensile strength and axial tensile strength
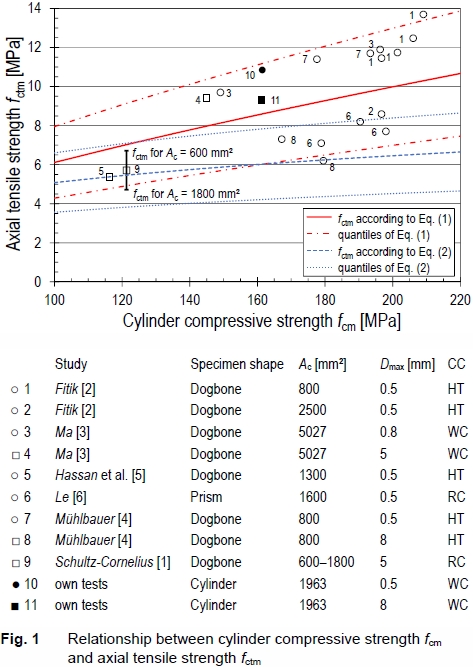
Figure 2 shows the relationship between flexural tensile strength and axial tensile strength as function of the section depth h. In addition to the results of the own investigations, the studies by Schultz-Cornelius and Fitik were considered. Furthermore, the curves according to Eqs. (3) and (4) are plotted, which are provided by EC 2 and fib Model Code 2010 to describe the relationship between the mean values of the axial tensile strength fctm and the flexural tensile strength fctm,fl.
 Both the own test data and that from Schultz-Conelius indicate a linear relationship between the ratio fctm,fl/fctm and the section depth h. However, the ratios from Schultz-Conelius are slightly higher than those of the own tests, which may be due to the different strength levels of the concretes in both studies. The ratios determined with the tensile strengths of the specimens with small stressed cross-section from Fitik fit in well with the own test data.
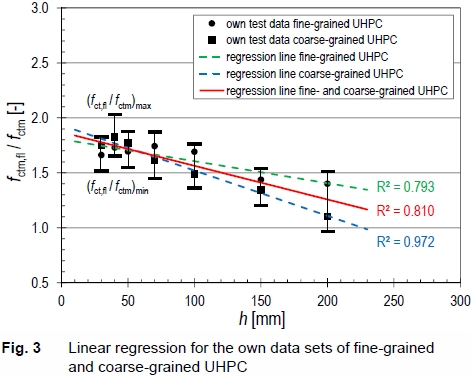
It can be noticed that the experimentally determined ratios fctm,fl/fctm are overestimated by Eq. (4) almost without exception. The ratios fctm,fl/fctm predicted by Eq. (3) tend to be too low for small section depths and too high for larger section depths, so that a modification of the approach based on the experimental data appears necessary. In order to decide whether a different treatment of fine-grained and coarse-grained UHPC is appropriate, a regression analysis was carried out for the data sets of the own investigations. A linear relationship between the ratio fctm,fl/fctm and the section depth h was assumed (see above). If the evaluation is carried out separately for the seven data sets of the fine-grained and coarse-grained UHPC, coefficients of determination R² of 79.3 % and 97.2 % are obtained (Fig. 3). If the 14 data sets of the two concretes are considered as part of a single population, the goodness of fit (R² = 81.0 %) is worse than for the coarse-grained UHPC alone. Given the limited sample size, it nevertheless appears justified not to differentiate between fine-grained and coarse-grained UHPC for the present when calculating the flexural strength. In Fig. 3, the error indicator characterises the smallest and largest individual value of the ratio fct,fl/fctm of a prism size. The approach proposed here for calculating the flexural tensile strength of UHPC is based on the red regression line in Fig. 3.
![]()
In Eq (5) fctm is the mean value of the axial tensile strength of fine-grained or coarse-grained UHPC and h is the section depth of the member or test specimen in mm.
 Summary of the results and conclusions
For the same compressive strength, coarse-grained UHPC tends to have a lower axial tensile strength than fine-grained UHPC. This may be due to the greater differences in stiffness in the microstructure of coarse-grained UHPC or to residual stresses due to shrinkage restraint caused by the coarse aggregate.
The condition of curing influences the axial tensile strength of UHPC. Specimens which are subjected to heat treatment or storage in dry climate tend to have a lower tensile strength than specimens that are cured in water until testing. The reduction in strength, which is stated by Ma to be about 25 %, is obviously dependent on the size of the cross-section. Specimens with very small cross-section provide high tensile strengths despite heat treatment or storage in dry climate. The axial tensile strength decreases as the size of the cross-section increases. It is assumed that the reduction in strength is caused by residual stresses due to a temperature or moisture gradient. The proportion of unsheathed border in the total perimeter of the cross-section of the tensile specimen (porous zone at the casting side) may also influence the tensile strength.
The equation from EC 2, which is applied for determining the mean tensile strength fctm of HSC by means of the mean cylinder compressive strength fcm, sometimes significantly underestimates the axial tensile strength of UHPC measured in experiments. This approach is therefore not suitable for concretes with fcm ³ 150 MPa. A better agreement between experimental and calculated tensile strengths is obtained by the equation from EC 2 that applies to NSC. The test results of almost all studies – whether fine-grained or coarse-grained UHPC – lie within the quantiles of this approach. Test specimens with large size of cross-section that have undergone curing by heat treatment or storage in dry climate are located at the lower range of this spectrum.
The difference between axial tensile strength and splitting tensile strength is small for UHPC. The approach fctm = fctm,sp is therefore recommended.
The flexural tensile strength of UHPC decreases approximately linearly with increasing section depth. The approach according to fib Model Code 2010 overestimates fctm,fl almost without exception, while the approach according to EC 2 tends to underestimate the flexural tensile strength for small section depths and to overestimate it for larger section depths. With increasing section depth h, the ratio fctm,fl/fctm decreases more rapidly for UHPC than for NSC and HSC. This can be attributed to the greater brittleness (lower specific fracture energy) of UHPC.
Based on the results of the own investigations and data from the studies by Schultz-Cornelius and Fitik, an approach for determining the flexural tensile strength is proposed that provides for a linear dependence of the ratio fctm,fl/fctm on the section depth h. With this approach, fctm,fl/fctm achieves a maximum value of 1.9 and becomes 1.0 for section depths h ≥ 270 mm. A different treatment of fine-grained and coarse-grained UHPC does not currently appear justified given the data availability and limited sample size.
Publications
LEUTBECHER, T.; SCHULLER, J., 2025. Axial and flexural tensile strength of thin members made of ultra-high-performance concrete | Zug- und Biegezugfestigkeit dünner Tragelemente aus ultrahochfestem Beton. In: Kongressunterlagen 69. BetonTage: Nachhaltigkeit neu Denken. Ulm, 11.-13. März 2025. Betonwerk und Fertigteil-Technik/Concrete Plant and Precast Technology. 91(3), 88. ISSN 0373-4331
SCHULLER, J.; LEUTBECHER, T., 2024. Einfluss der Querschnittshöhe auf die Biegezugfestigkeit von ultrahochfestem Beton. Beton- und Stahlbetonbau. 119(4), 242-252. doi:10.1002/best.202300095
Supporting Information: Data S1. Ergebnisse der Festigkeitsprüfungen